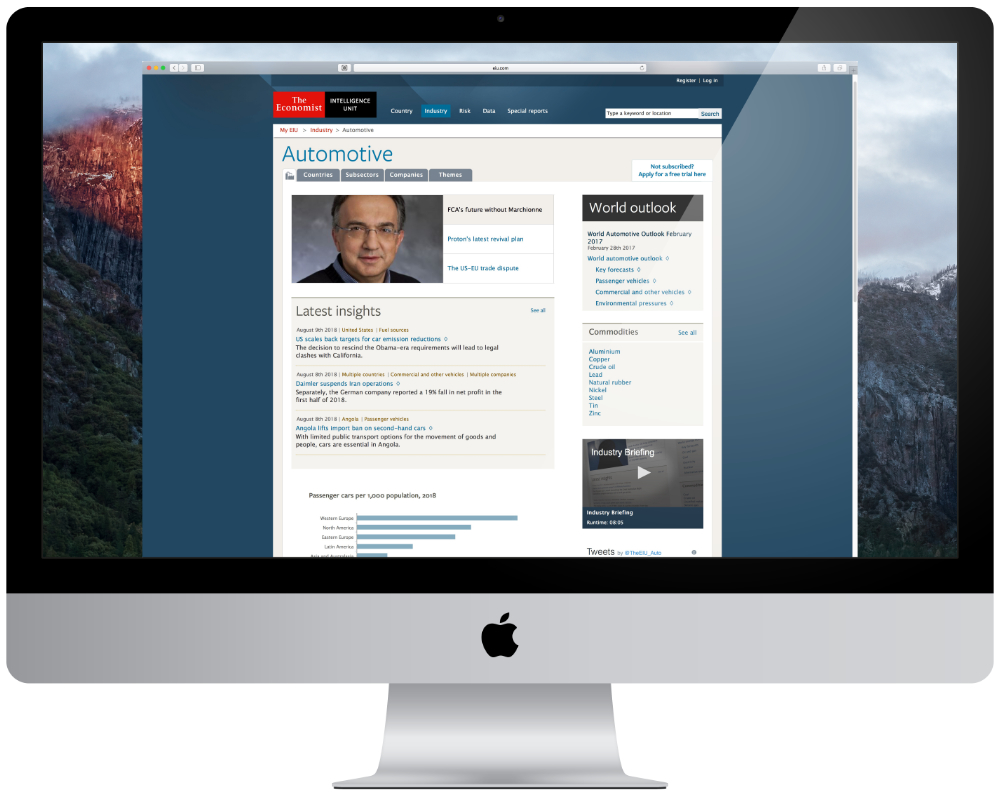
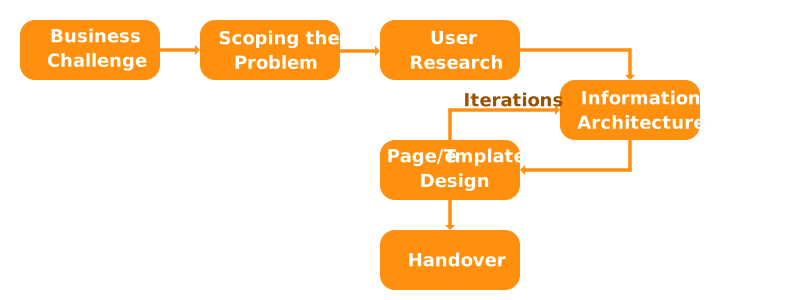
Redesigned the Economist Intelligence Unit's industry information product to improve navigation, clarity and increase cross-sell of related subscription content. I led the UX work end-to-end, from analytics and stakeholder research through information architecture, interaction design, testing and developer handover.
Product Design - UX Design - Information Architecture - Prototypes - User Flows - Workshops - Stakeholder Management - Analytics
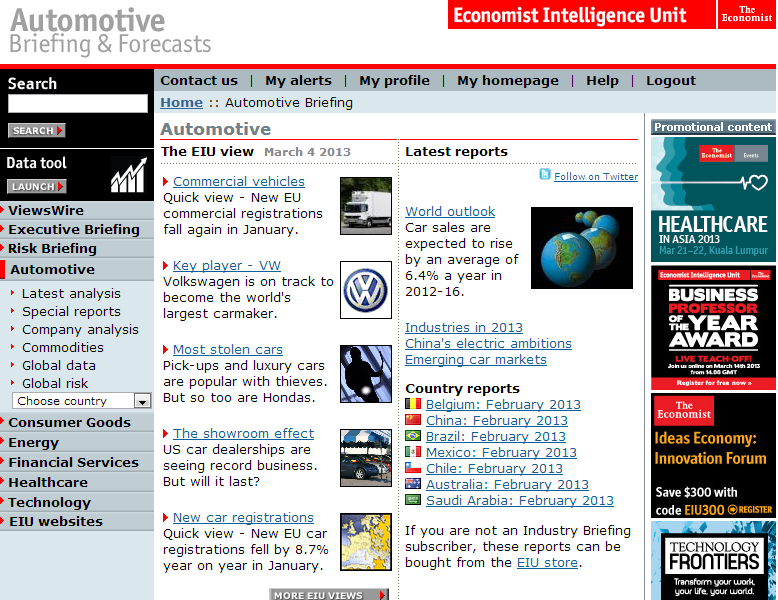
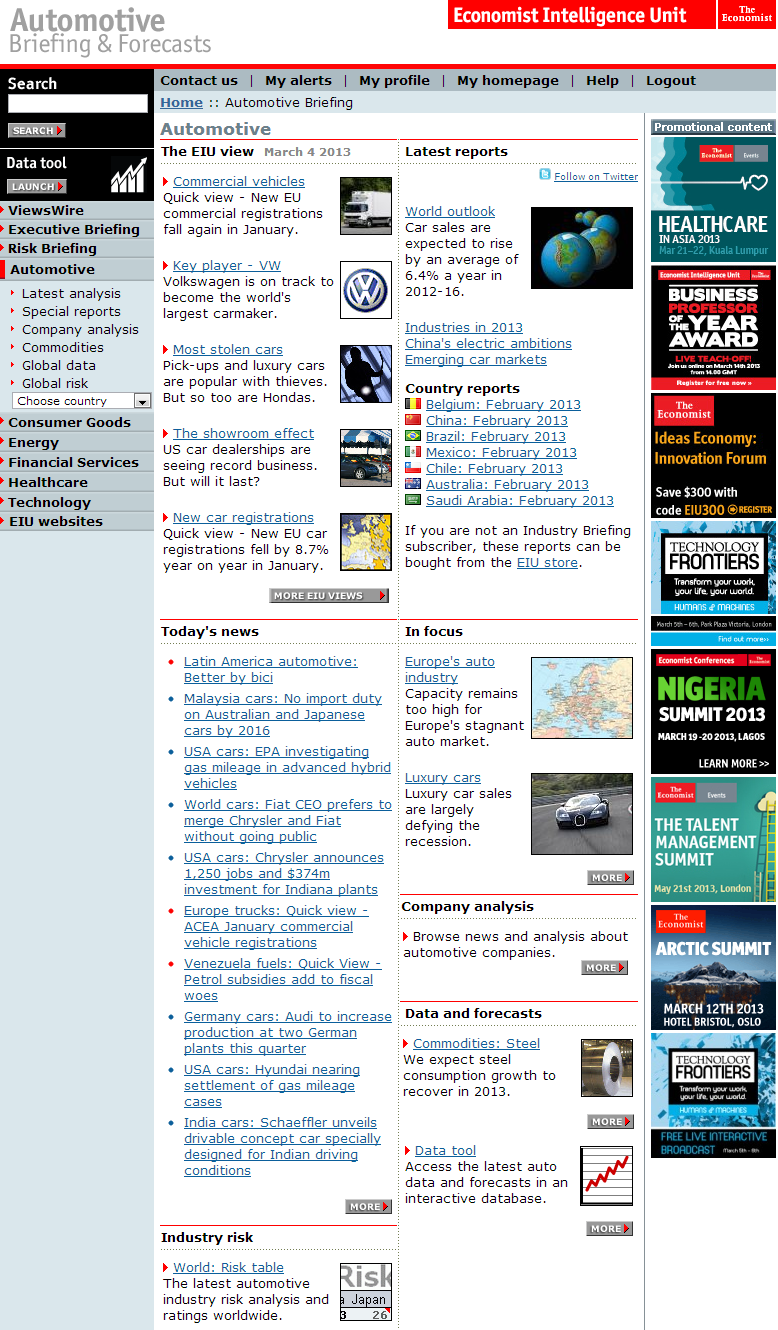
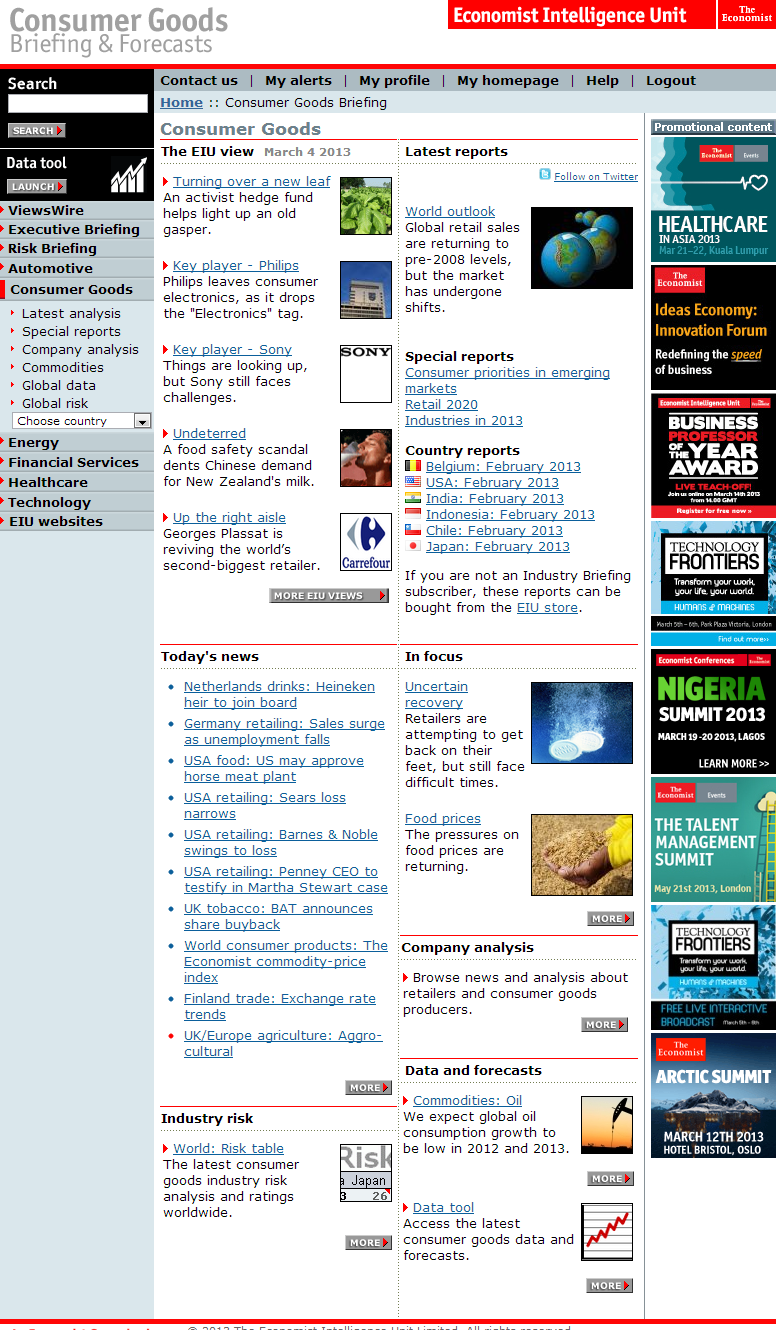
The two below pictures were the original design.
This client had three content-based products and reported being unhappy with the general UI design, specifically the layout and navigability and usability, and a desire to increase the cross-sell.
One product had already been updated but the client felt this could be bettered.
My job was to transform the industry product and make it better. There was considerable ambiguity as to how and I had to provide insight.
Below are examples of the original site. This is what I was transforming.
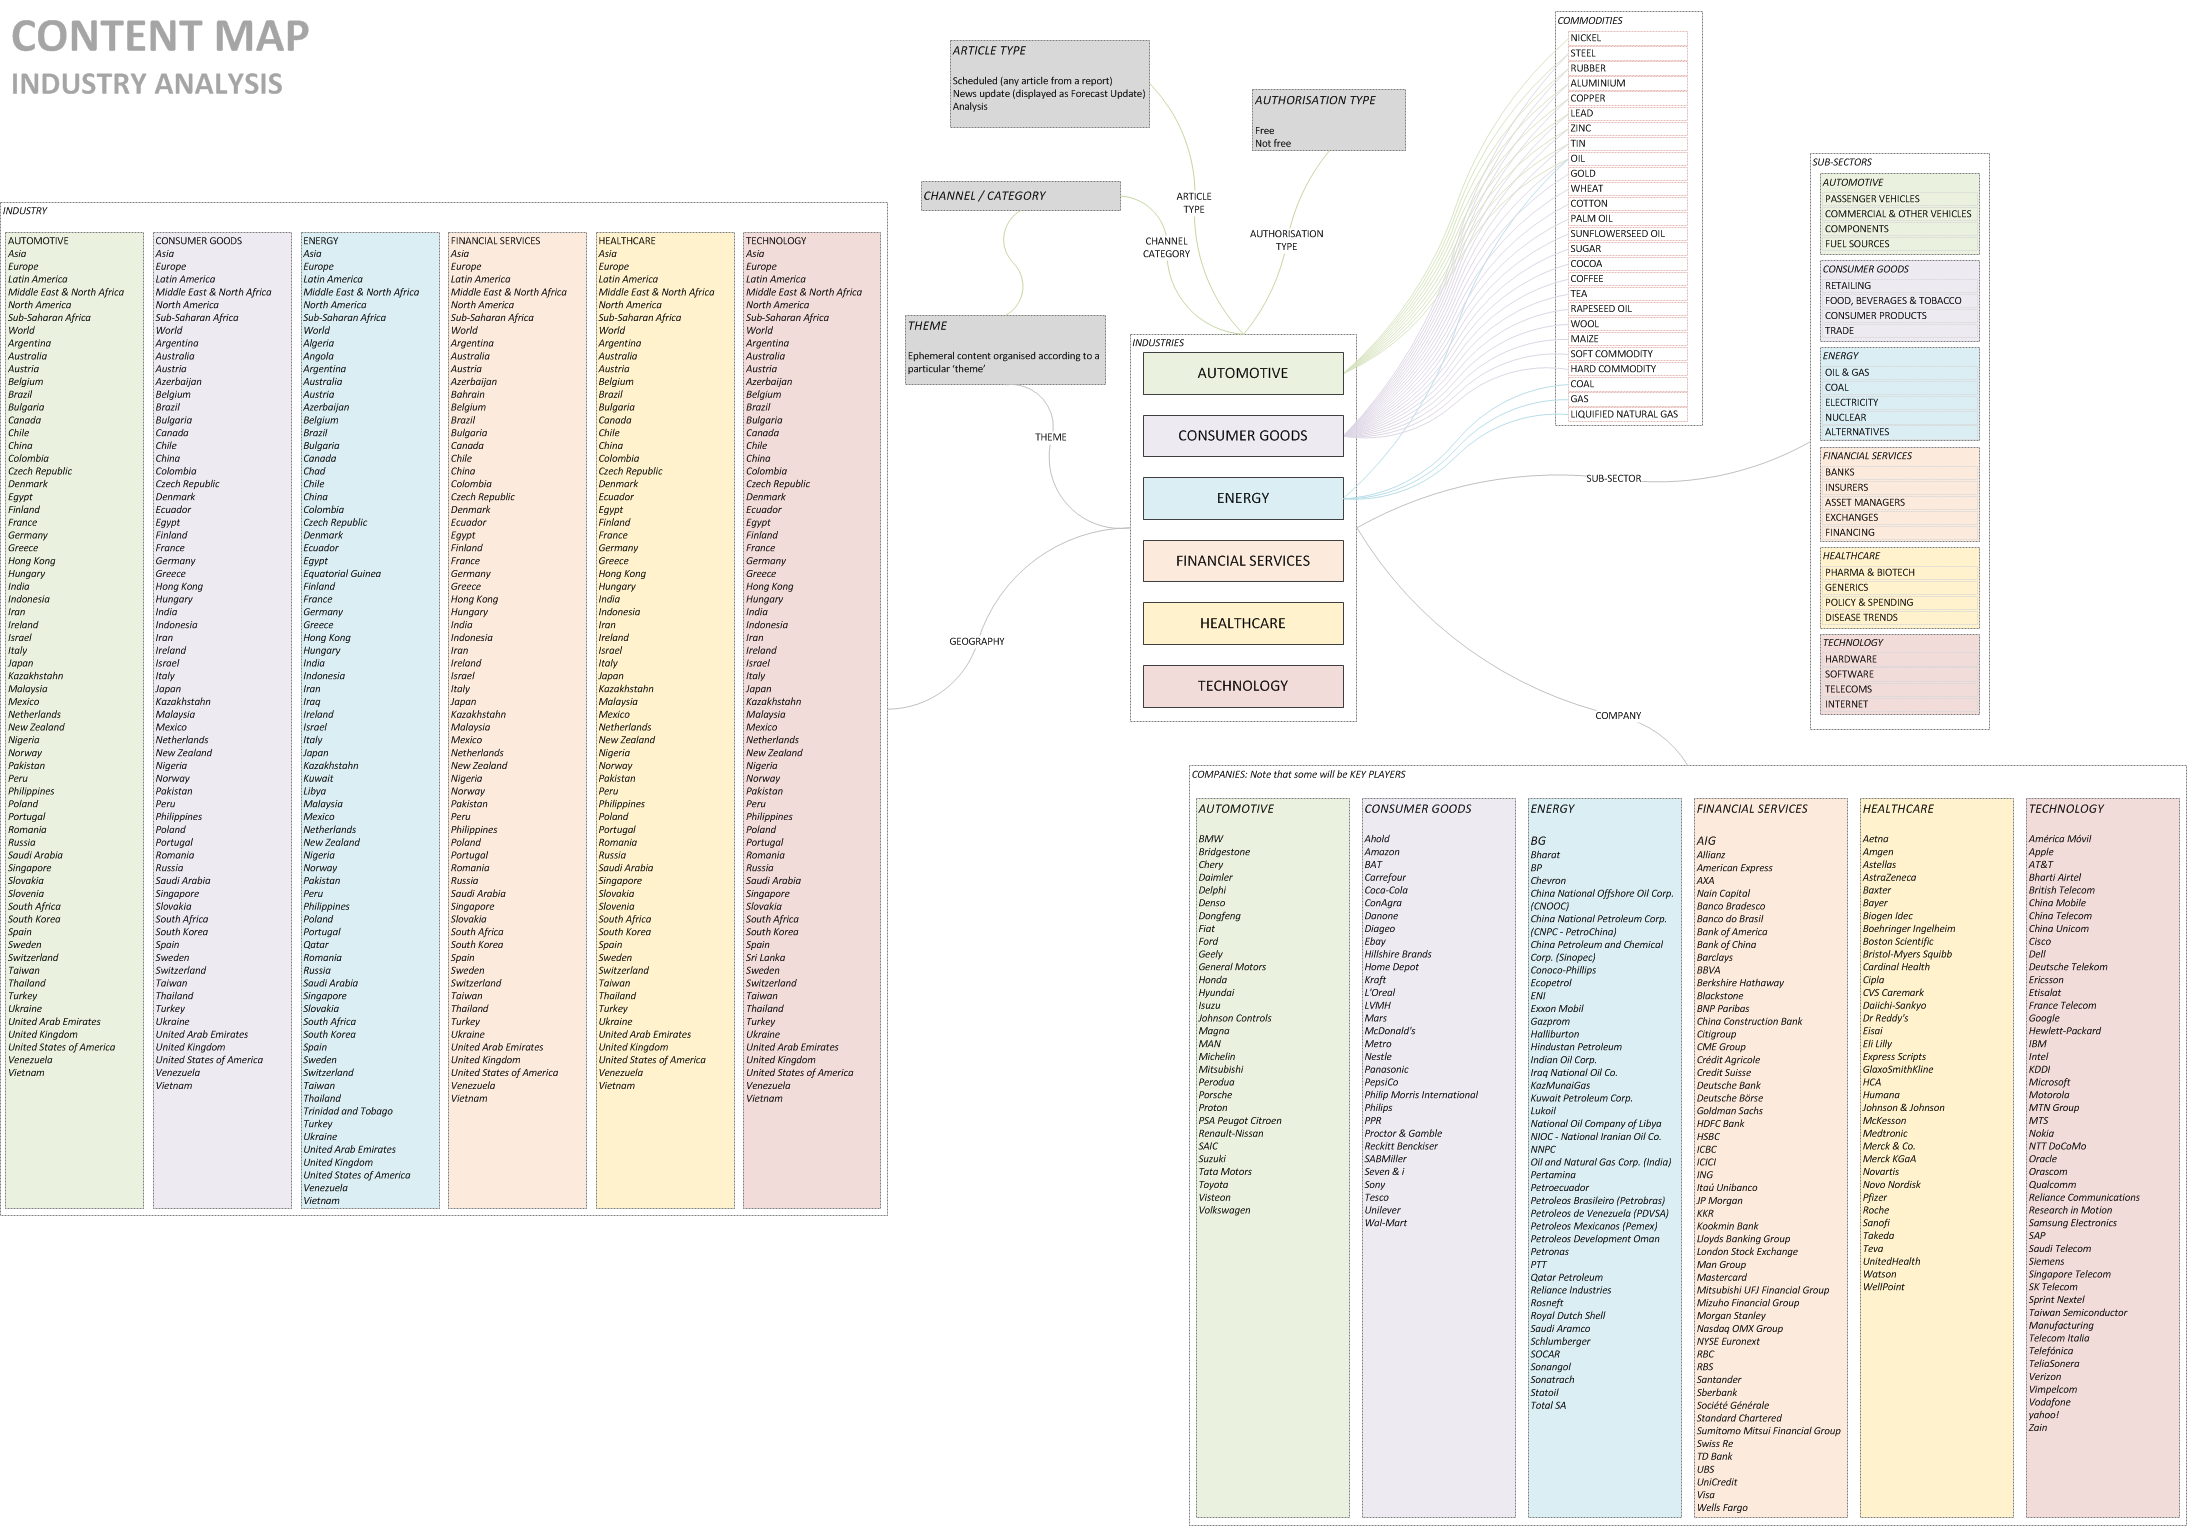
What was I working with? This was not defined anywhere so I made a content inventory to assess the scale of work and rationalise content into templates: I had to understand the problem space first by mapping out the content hierarchy.
I created a full content inventory of the industry information using several maps that reflected different approaches to the data. This showed how all the different components related to each other and how they were grouped in ways that were meaningful to users and editors.
Outcomes: This helped understand the current system and a quick heuristic analysis furnished me with sufficient detail to gain insight into the challenges that users faced in finding what they needed.
I examined analytics for user behaviours / user journeys: How did users get around? How did they navigate? When did they go down a rabbit warren only to turn back?
I interviewed stakeholders to understand the business needs, what challenges they faced, what they wanted from a redesign and the many constraints necessary for a new design to take into account including desired marketing messages.
Outcomes: Cross-sell was "baked-in" to increase subscriptions by offering related content, navigation was made easier and topics of interest could be located more easily. Social media was used to complement the publishing cycle and visualisations were used to make the site less text-heavy.
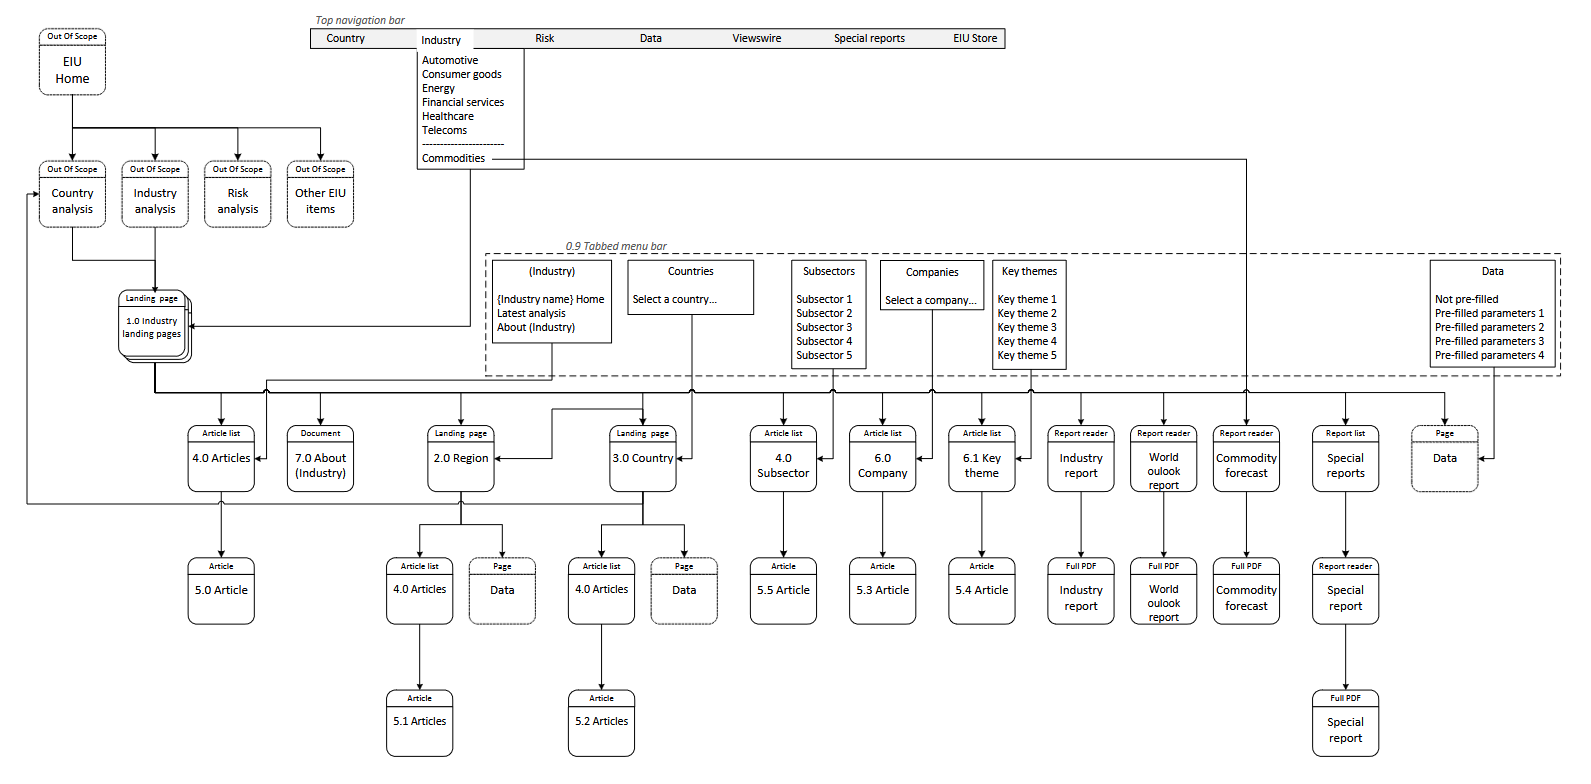
I created a draft sitemap/information architecture which iterated as work progressed, and tested how users would get from one point to another followed by how this could be smoothed.
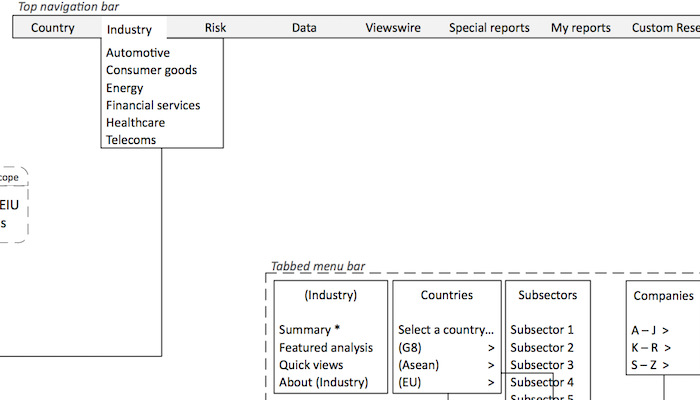
The final draft of the sitemap was intended for developers and stakeholders and worked to illustrate how everything held together. Separate maps of the navigation system (desktop and mobile) communicated how users would navigate from point to point.
The final artefact from this phase was that I could calculate the number of templates required for this transformation.
Outcomes: By now, we had all the information in detail, we had a good idea how it should be structured and we knew what templates were needed for this transformation.
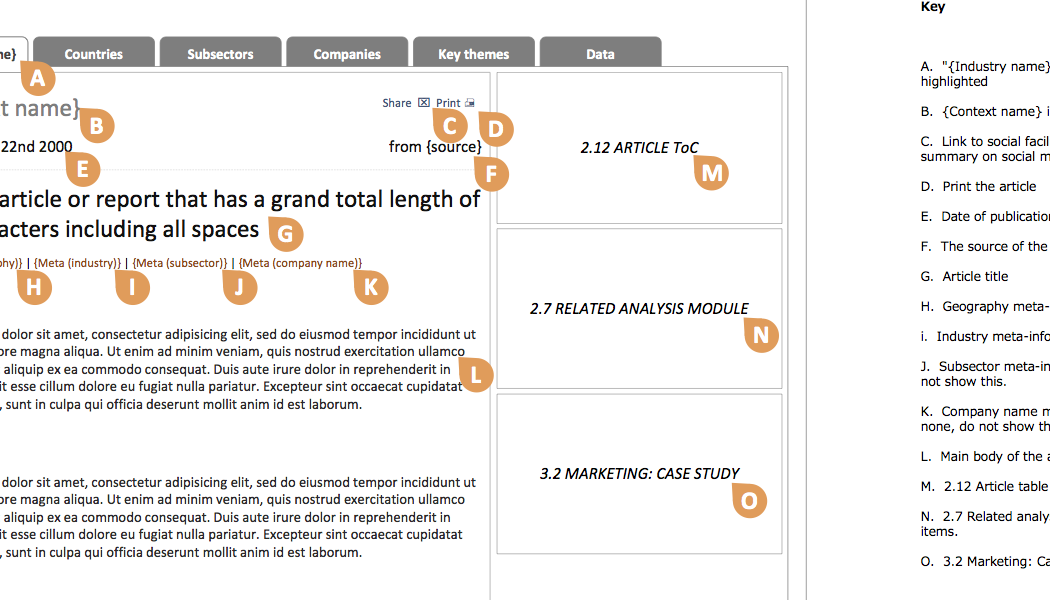
The image below shows some screenshots of sketched designs. Once there was internal business support for the designs, they were documented in a more formal way.
This work included calculating the number of templates needed to convey all of the client's information to customers.
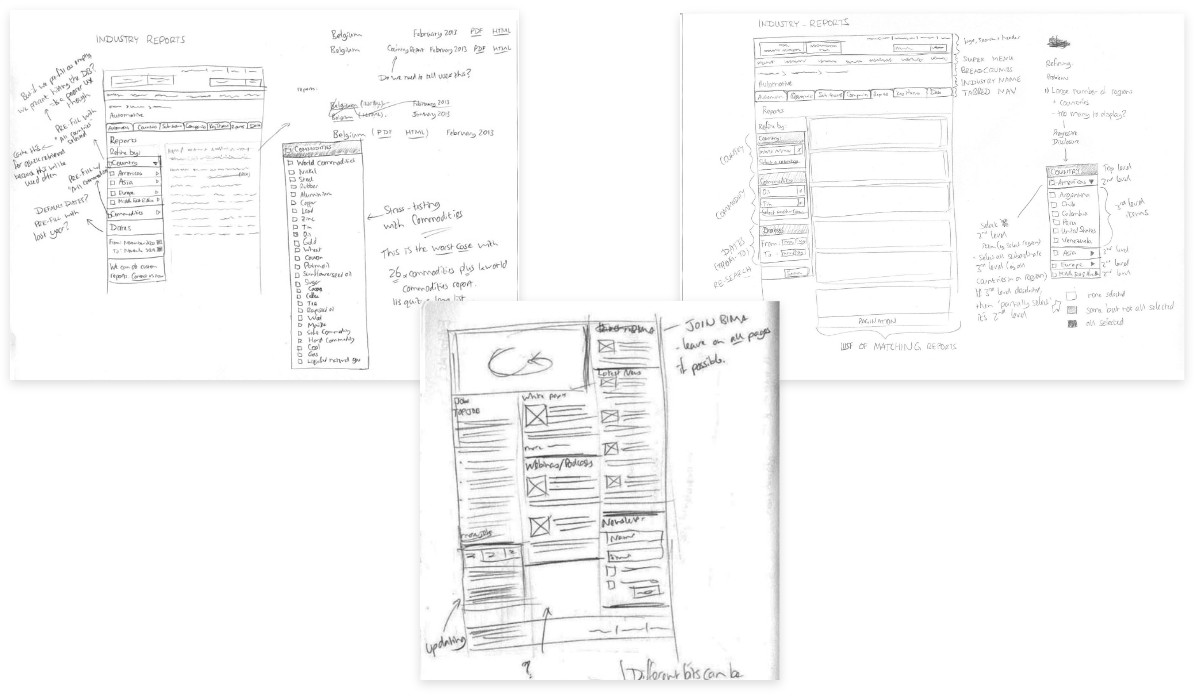
Outcomes: Wireframes were sketched for free ideation and rapid feedback from stakeholders. Doing this allowed me to create many sketches for templates in a short space of time and finalise the design.
The designs received some usability testing but less than an ideal amount but was necessary given project funding restrictions.
The testing showed that users handled the new version better than the existing version with fewer misunderstandings about subscriptions and product visibility, more accurate navigation, and better focus.
I began to create annotated wireframes to pass the design to the development team. This included some clickable prototypes in HTML/CSS and JQuery (JavaScript) to illustrate how different widgets were meant to work.
Outcomes: The final site was handed over to the developers over a series of meetings and was built and released. See the very first picture for an example, or see for yourself.